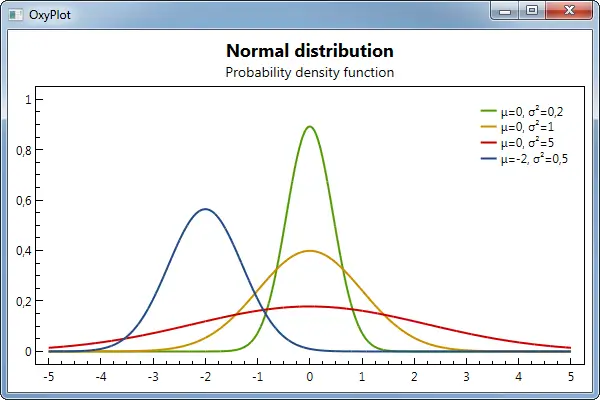
官方网址:https://oxyplot.readthedocs.io/en/latest/index.html#

首先定义Model和Model中要显示的曲线,这里先设置三条曲线。
private PlotModel myModel = new PlotModel();
private LineSeries series1 = new LineSeries();
private LineSeries series2 = new LineSeries();
private LineSeries series3 = new LineSeries();
然后,可以在函数中对Model和Series进行初始化,并将我们定义的myModel赋值给UI界面中拖进来的plotView.Model
myModel.Series.Add(series1);
myModel.Series.Add(series2);
myModel.Series.Add(series3);
this.plotView1.Model = myModel;
var xAxis = new LinearAxis
{
Position = AxisPosition.Bottom,
//IsAxisVisible = false, // 隐藏 X 轴
IsZoomEnabled = true, // 允许缩放
//IsPanEnabled = true // 允许拖动
//MajorGridlineStyle = LineStyle.Solid, // 显示主要网格线
//MinorGridlineStyle = LineStyle.Dot, // 显示次要网格线
LabelFormatter = value => "" // 隐藏数字,只保留刻度
};
myModel.Axes.Add(xAxis);
// 配置 Y 轴
var yAxis = new LinearAxis
{
Position = AxisPosition.Left,
Title = "value"
};
myModel.Axes.Add(yAxis);
var myController = new PlotController();
//myController.UnbindMouseWheel();
this.plotView1.Controller = myController;
}© 版权声明
文章版权归作者所有,未经允许请勿转载。
相关文章
没有相关内容!

暂无评论...